Click Here for PDF Copy which includes a list of exported fields that are in each report.
NOTE - Labels will change in cost reports for Schedule 2 clients |
| Report Name |
Report View (click image) |
Export Headings |
Report Description |
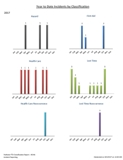
YTD Incidents by Class
|
DHA
|
Inc Date
Key Number
Classification
Last Name
Department
Group
Status Desc (claim) |
Reports the classification details of incidents occurring in the CURRENT year.
- Main sheet: Charts of each classification YTD and a table with numbers by month and classification YTD.
|
YTD Incidents by Type
|
DHB
|
Inc Date
Key Number
Inc Type Desc
Classification
Department
Group
Status Desc (claim) |
Reports the incident type details of incidents occurring in the CURRENT year (regardless of status of claims). REOs are included in totals but can be removed after the report is run.
- Main sheet: Chart of number of incidents by type YTD. Chart of number of incidents by month and type YTD. Table of incidents occurring by month and by type YTD.
|
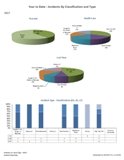
YTD Incidents by Class/Type
|
DHC
|
Inc Date
key Number
Last Name
Department
Group
Classification
Inc Type Desc
Status Desc (claim) |
Reports the incident types and classification of incidents occurring in the CURRENT year (regardless of status of claims).
- Main sheet: Pie charts of each class and percentage of type of incident. Chart with number of incidents by class and type.
|
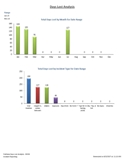
Days Lost Analysis
|
DHD
|
Inc Date
Key Number
Last Name
Department Group
Inc Type Desc
Classification
Days Lost
Status Desc (claim)
Dept Description
Union
|
Shows analysis of the total days lost incurred of incidents occurring in date range.
- Main sheet: Bar chart of total days lost by type of incident. Chart of total days lost by union.
- Second sheet: Table of days lost by type of incident, summarized by Dept/Group. Includes Inc Date, Name, Status of claim.
|
Costs Analysis
|
DHE

|
Inc Date
Key Number
Last Name
Department Group
Inc Type Desc
Classification
Cost
Other Cost
Status Desc (claim)
Dept Description
Year End
Rehab Cost
Health Care Cost
Compensation Cost
Pension Cost
SIEF Cost
Other 1 Cost
Other 2 Cost
Other 3 Cost
Other 4 Cost
Other 5 Cost
Firm Number
Rate Number
Emp Number
Claim Number
NAICS Code
|
Shows analysis of the total costs incurred of ONLY incidents occurring in date range. (for actual costs, see DHF). NEW Report allows user to filter by firm or rate number.
- Main sheet: Bar chart of total Lost Time Costs and total Health Care Costs, charts of costs by classification, chart of costs by type, charts of costs/other costs by year (if date range permits). Charts of other costs by classification, chart of other costs by type.
- Second sheet: Detailed table of costs by classification and year.
- Third sheet: Detailed table of costs by incident type and year.
- Fourth sheet: Cost and Other Costs totals table by Dept/Group and by year.
- Fifth sheet: Table by Dept/Group, employee name, with total detailed costs of the claims that occurred in date range.
- Sixth sheet: Table by Dept/Group, employee name, with total detailed other costs of the claims that occurred in date range.
|
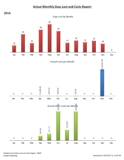
Actual Monthly Days/Costs
|
DHF
|
Month
Department Group
Lost Days
Cost
Other Cost
Year
Dept Description
Rehab Cost
Health Care Cost
Compensation Cost
Pension Cost
SIEF Cost
Other 1 Cost
Other 2 Cost
Other 3 Cost
Other 4 Cost
Other 5 Cost
NAICS Code |
Shows actual days lost and costs generated per month (regardless of date of incident) for the year chosen.
- Main sheet: Pie chart of percentage of costs applied by type of cost. Pie chart of percentage of days lost by month. Charts of actual days applied each month, actual costs applied each month and other costs applied each month.
- Second sheet: Table of detailed costs by month and detailed other costs by month for organization. Summary table of total days lost, costs and other costs.
- Third sheet: Table of detailed costs by Dept/Group and month.
- Fourth sheet: Table of detailed other costs by Dept/Group and month.
- Fifth sheet: Summary table by Dept/Group of total lost days, costs and other costs by month.
- Sixth sheet: Summary table by Dept/Group of total lost days, costs and other costs by month with page break.
|
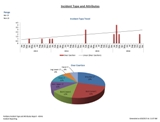
Incident Type & Attributes
|
DHG
|
Inc Date
Key Number
Department Group
Last Name
Inc Type Desc
Attribute
Status Desc (claim)
Classification
Dept Description
Year End
Union
|
Analysis of a type of incident by attributes. (1 type, up to 10 attributes)
- Main sheet: Pie chart of classification for that inc type, pie of attribute for that inc type. Bar chart of attribute totals by year. Chart of incident type totals by year and month.
- Second sheet: Table of number of incidents (of that inc type) occurring with selected attributes by attribute, month and year.
- Third sheet: Table of number of incidents (of that inc type) occurring with selected attributes by Dept/Group. Summarized attribute and year.
|
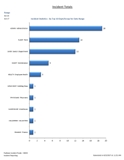
Incident Totals
|
DHH
|
Inc Date
Key Number
Department Group
Last Name
Status Desc (claim)
Classification
Inc Type Desc
Dept Description
Year End
Dept Code
Union
Current Position
Incident Position
|
Incident totals by year, class, type and department.
- Main sheet: Pie chart of Incidents by class. Pie chart of incidents by union. Bar chart of # of incidents by type. Chart of top 10 highest incidents by Dept/Group.
- Second sheet: Table of incident type totals by class.
- Third sheet: Table of incident type totals by class and year.
- Fourth sheet: Table of incident class totals by type and year.
- Fifth sheet: Table of dept/group totals by incident type.
- Sixth sheet: Table of dept/group totals by incident class.
|
Incident Causes
|
DHI
|
Inc Date
Key Number
Department Group
Last Name
Status Desc (claim)
Classification
Cause
Dept Description
Year End
|
Incident Causes detail.
- Main sheet: Chart of causes and number of times it was applied* to incidents.
- Second sheet: Table of causes including which Dept/Group had those causes and the number of times per year (if date range permits).
(*any one incident can potentially have up to 5 causes applied)
|
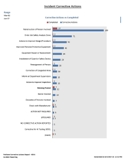
Incident Corrections
|
DHJ
|
Inc Date
Key Number
Department Group
Last Name
Status Desc (claim)
Classification
Correction
Person Assigned
Completion Date
Comments
Inc Type Desc
Dept Description
Happened
Doing
Attribute
Action Taken
Worksite
Detailed What Happened
Detailed Doing
Supervisor (PD)
Employee ID
Recommendation
Dt Email Sent
Dt Action Taken
|
Incident Corrections detail chosen by date range (of inc date) and additional option to filter results by choose 1 associated attribute.
- Main sheet: Bar chart of # of corrective actions vs. # of completed by classification. Bar chart of # of corrective actions vs. # of completed in total. Bar chart of # of corrective actions vs. # of completed by Incident Type.
- Second sheet: Bar Chart of # of corrective actions the # of them that are complete by corrective action type.
- Third sheet: Details of which corrective actions are assigned and to whom, name of employee, type, what happened, correction, action comments, and target dates.
- Fourth Sheet: Detailed table by who is responsible including date of inc, class, inc type, name, detailed happened, detailed doing, correction, total corrections by who is responsible and how many are complete.
- Fifth Sheet: Detailed (legal size) table by Inc Date including emp name, inc type, detailed what happened, detailed doing, correction, action comments, action taken, target date and completion date.
(*any one incident can potentially have up to 5 corrections applied)
|
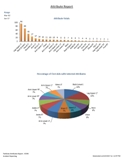
Attributes Report
|
DHK
|
Inc Date
Key Number
Department Group
Last Name
Status Desc (claim)
Classification
Inc Type Desc
Attribute
Dept Description
Union
Injury
Location
Injury/Critical/Illness
Emp ID
Employee Status
Supervisor
Year End
|
Analysis of up to 30 attributes.
- Main sheet: Pie chart of percentage of attributes – one for each 4 classifications. Chart of attribute and total number of times it was used in that date range. Stacked bar chart of attribute totals by class. Chart of top 10 highest number of Dept/Groups in which those attributes occurred.
- Second sheet: Table of total attributes* by classification.
- Third sheet: Table of attributes and incident types and how many times* that attribute occurred.
- Fourth sheet: Table of attribute counts by year.
- Fifth sheet: Table of Dept/Group and the attribute totals.
(*count of attribute, not incident)
|
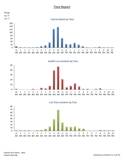
Time Report
|
DHL
|
Inc Date
Key Number
Department Group
Last Name
Status Desc (claim)
Classification
Inc Type Desc
Time
Dept Description |
Analysis of incident occurrence times – 99:99 and blank times on incidents are not included
- Main sheet: Chart of incidents and time of day they occurred. Charts of all incidents, health care incidents and lost time incident times.
- Second sheet: Table of Dept/Group and their incident types.
|
Incident Trend
|
DHM
|
Inc Date
Key Number
Department Group
Last Name
Status Desc (claim)
Classification
No active employees in dept group
Inc Type Desc
Dept Description
Year End
Union
Supervisor ID
Emp #
|
3 year* analysis of incidents.
- Main sheet: Line graph of incident totals by year and month. Chart of incident totals by type over 3 years. Chart of incident totals by class over 3 years.
- Second sheet: Table of each Dept/Group and incident totals over 3 years by Inc Type.
- Third sheet: Table of incident types and incident totals by years and month.
- Fourth sheet: Table of classification and incident totals by year and month.
- Fifth sheet: Table of incident type totals by year and classification.
(*up to 3)
|
Days & Costs Trend
|
DHN
|
Inc Date
Key Number
Department Group
Last Name
Status Desc (claim)
Classification
No active employees in dept group
Total Costs associated with that claim
Other Cost
Total days associated with that claim
Inc Type Desc
Year
Month
Dept Description
Year End
Claim Number
Union
Rehab Cost
Health Care Cost
Compensation Cost
Pension Cost
SIEF Cost
Other 1 Cost
Other 2 Cost
Other 3 Cost
Other 4 Cost
Other 5 Cost
Firm Number
Rate Number
Employee Number
NAICS Code
|
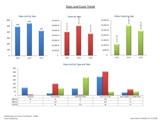
Up to 3 analysis of ACTUAL days and costs generated within that time frame (regardless of when the incident occurred). Can filter by firm and/or rate number.
- Main sheet:
- Chart of days lost in that year(s).
- Chart of costs in that year(s).
- Chart of other costs in that year(s).
- Chart of days lost in that year(s) by incident type.
- Chart of costs in that year(s) by incident type.
- Chart of other costs in that year(s) by incident type.
- Second Sheet: Detailed costs by incident type and year.
- Third sheet: Detailed costs applied by year and month.
- Fourth sheet: Detailed costs applied by year and incident type.
- Fifth sheet: Days lost by year and type, Days lost by month and year.
- Fifth sheet: Dept/Group summary table with Costs, Other Costs and Days Lost by year.
(*up to 3) |
YTD Injuries
|
DHP
|
Inc Date
Key Number
Classification
Last Name
Department
Group
Status Desc
Location
Inc Type Desc
Injury
Was NonOccupational
Worksite |
Reports the Year to Date Injury and Location details of the CURRENT year. Particularly for those who utilize the Injury and Location tables in Incident Reporting or use Online Incident Reporting.
- Main sheet: Bar chart of top 10 injuries, pie charts of Lost Time and Health Care injuries, bar chart of top 10 locations, line chart of incident types by classification.
- Second sheet: Table of Location and Injury numbers by classification
- Third sheet: Table by Dept/Group of injury numbers by classification.
- Fourth sheet: Table of injury numbers by classification.
- Fifth sheet: Injury numbers by type.
- Sixth sheet: Location numbers by classification.
- Seventh sheet: Location numbers by type.
|
Incident Statistics
|
DHR

|
Inc Date
Key Number
Department Group
Last Name First
Status Desc
Classification
Inc Type Desc
Department Desc
Injury
Location
Miscellaneous
Year End
Was NonOccupational
Worksite
Union
Supervisor (PD)
Employee ID
|
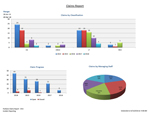
Pull report by date range and dept/group. Reports various incident statistics.
- Main sheet: 3 pie charts of LT, HC and FA of percentage of incident types. Stacked bar chart of incident types & classification. Bar chart of LT, HC and FA by year. Line chart of LT, HC and FA by month. Bar chart of incident types by year.
- Second sheet: Bar charts of top 10 Locations and Injury totals by classification for range.
- Third sheet: Table report numbers of incident types & years by classification.
- Fourth sheet: Table report by Dept/Group – of incident types and years.
- Fifth sheet: Table report of numbers of injuries by year (best if injury table is used)
- Sixth sheet: Table report of incident locations by year (best if location table is used)
|
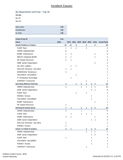
Frequency and Severity
|
DHS
|
Year
Department Group
Department Desc
Pd Hrs Wkd
Frequency Factor
No of incidents
Frequency Rate
Severity Factor
No Lost time Days
Severity
Date Range Chosen |
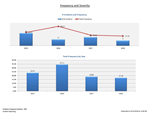
This report has multiple options to pull depending on your preference, including: date range, which classification of incident(s) to pull, count days lost for incidents occurring in range or days lost for in the range regardless of incident date, dept/group.
- Main sheet: Bar graph of number of incidents with frequency intersecting on a line. Bar graph of frequency numbers by year. Bar graph of number of lost time days with severity intersecting on a line. Bar graph of severity numbers by year.
- Second sheet: Table report of numbers overall by year – including number of incidents, frequency, number of lost time days and severity.
- Third sheet: Table report by year and dept/group – includes #hours worked, # incidents, frequency, #of lost time days and severity.
- Fourth sheet: Displays data by individual department. Choose department or group. Graphs on right change to reflect rates based on dept/group chosen. Graphs include: Bar chart of # of incidents by year and frequency by year. Bar chart of # of lost time days by year and severity by year.
|
Who's Off
|
DHT

|
Inc Date
Key Number
Department Group
Last Name First
Status Desc
Classification
Inc Type Desc
Department Desc
Injury
Location
Miscellaneous
Claim No
Managing Staff
Last Day worked
Expected RTW
Guidelines
RTW Date
Days Lost
Review Date Activity
Year End
Union
User Notes
Supervisor
Emp ID
Position
Additional Dept 1
Additional Dept 2
Employee Status
First Day Off
Closed
Closed Date
Adjudicator Name
Adjudicator Phone No
|
Pull by dept/group and managing staff. Displays all LT and LT-REO claims with no RTW date.
- Main sheet: Pie chart of Who’s Off by claim status. Pie of Who’s off by Managing staff. Pie chart of Who’s Off by Incident Type. Chart of who’s off numbers by type. Chart of Who’s off numbers by claim status.
- Second Sheet: Table report sorted by name including date, name, claim#, claim status, managing staff, classification, incident type, Injury, expected RTW, days lost to date.
- Third Sheet: Table sorted by managing staff, includes name, claim status, injury, inc type, claim number, expected RTW, last review date and activity.
- Fourth Sheet: Sorted by dept/group, date of incident, name, claim#, managing staff, class, incident type, expected RTW days lost and case count by dept/group.
- Fifth Sheet: Sorted by Managing staff, includes name, Union, claim#, class, injury, inc date, last day worked, expected RTW and case count by managing staff.
- Sixth Sheet: Sorted by year of incident, includes date of incident, name, claim #, class, injury, last day worked, expected RTW, case count.
|
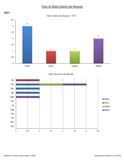
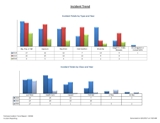
Claims Report
|
DHU
|
Inc Date
Key Number
Department Group
Last Name First
Status Desc
Classification
Inc Type Desc
Department Desc
Injury
Claim No
Managing Staff
Last Day worked
Expected RTW
RTW Date
Days Lost
Location
Miscellaneous
Closed
Closed Date
Year End
Was NonOccupational
Worksite
Returned to Mod Duties
Limitation period
Mod Duties Start
Mod Duties Stop
Union
Supervisor (PD)
Emp ID
Position
Additional Dept 1
Additional Dept 2
Status Date
Treatment Date
Employee Status
Cause Description 1
Department Code
Inactive
|
Report pulls by date range, dept/group and managing staff. Includes all LT, HC, REO and HREO claims open and closed.
-
- Main sheet: Bar graph with # of claims sorted by classification and year. Bar graph with # of claims open and closed by year. Pie chart of claims by percentage of managing staff.
- Sheet two: Table of # of claims by claim status, class and year.
- Sheet three: Table report sorted by dept/group, includes employee name, inc date, claim #, inc type, last day worked*, expected RTW*, RTW date*, managing staff, # of closed claims, days lost* and incident count.
- Sheet four: Table report sorted by managing staff, includes name, department, inc date, claim#, class, injury, last day worked*, expected RTW*, RTW date*, # of claims closed, days lost* and incident count.
- Fourth Sheet: Table report sorted by managing staff, includes name, inc date, claim #, class, injury, expected RTW, RTW, Return to mod duties (Y/N), Limitation period, mod duties start, mod duties stop and # of closed claims.
*if applicable |
Workplace Violence
|
DHW
|
Last Name First Name
Current Position
Incident Position
Supervisor
Location
Current Union
Incident Union
Dept Code
Department
Incident Date
Incident Time
Reported Date
Reported Time
Inc Description
Injury
Status
Classification
Incident number
Key number
Year End
VIOLENCE
All Violence Headings
HARASSMENT
All Harassment Headings
WEAPON(S)
All Weapons Headings
AGR-Worker
AGR-WrkrNm
AGR-3rdPty
AGR-Rel1
AGR-ROth1
AGR-Rel2
AGR-ROth2
AGR-Info
Domestic
PriorInc
PriorExp
POLICE-CALL
All Police Headings
MOL-ADVISED
All MOL Headings
Witness1
Witness2
Dept-Group
Investigation completed
CorrAct Identified
Claim Number
Corr Act 1
Person 1
Date Assigned 1
Target Date 1
Recommendation 1
Action Taken 1
Completed Date 1
Corr Act 2 Person 2
Date Assigned 2
Target Date 2
Recommendation 2
Action Taken 2
Completed Date 2
Corr Act 3 Person 3
Date Assigned 3
Target Date 3
Recommendation 3
Action Taken 3
Completed Date 3
Corr Act 4
Person 4
Date Assigned 4
Target Date 4
Recommendation 4
Action Taken 4
Completed Date 4
Corr Act 5
Person 5
Date Assigned 5
Target Date 5
Recommendation 5
Action Taken 5
Completed Date 5
What Happen Details
What Doing Summary
What Doing Details
|
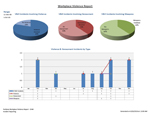
Report pulls by date range and dept/group. Displays all incidents of workplace violence in which the violence and harassment panel was completed.
- Main sheet: Pie charts showing percentage of V&H incidents that included violence, those that included harassment and those involving weapons. Bar chart of # of V&H with type intersecting on a line. Bar chart breakdown of violence, harassment and weapons detail #s by year.
- Sheet two: Bar charts of violence, harassment, weapons, police involvement, and MOL involvement all by year. Bar chart of # of V&H incidents by year with type intersecting on a line.
- Sheet three: Table report of dept/group stats by year which includes # of those that include violence, harassment, weapons, police involvement and MOL contacted.
- Sheet four: Table reports of unions and positions by year showing numbers of V&H incidents broken down into violence, harassment and weapons.
- Sheet five: Detailed table report sorted by department includes – name, reported date, class, injury and totals of violence, harassment, weapons, police involvement, MOL contacted.
|
Corrective Action Details
|
DHX
|
Inc Date
Key Number
Department Group
Last Name First
Status Desc
Classification
Correction
Person Assigned
Position or Company
Telephone
Email
Date Assigned
Target Date
Completion Date
Comments
Inc Type Desc
Department Desc
Worksite
Happened
Doing
Add Info
Attribute
What Happened DTL
What Doing DTL
Emp ID
Action Taken
Recommendation
Date Email Sent
Date Action Taken Received
|
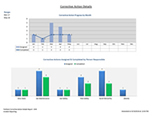
Report pulls by corrective actions by date range and dept/group. If desired, this report also allows you to view all corrective actions where the incidents are tagged with a specific attribute.
- Main sheet: Bar/line chart demonstrating # of corrective actions assigned and # of completed. Bar chart of assigned vs completed corrective actions by those responsible.
- Sheet two: Report table by month of incident, incident type, happened, doing, comments, target date, action taken and completion date.
- Sheet three: Table of Inc Date, month, type, detailed happened, detailed doing, action taken, target date and completion date. Can filter by person assigned, worksite and/or department.
- Sheet four: Table report of worksite corrective actions by those responsible and include the chosen correction, comments, target date, and completion date. Also includes number of assigned and number completed by worksite.
- Sheet Five: Table reports on numbers by corrective action chose, assigned and completed.
|
Appeals Summary
|
DHY
|
Inc Date
Employee Key Number
Last Name First
Employee ID
Claim Number
Status Desc
Incident Type
Incident Class
Injury
WSIAT
Initial Decision Date
Final Decision Date
Estimated Costs
Final Decision Costs
Estimated Savings
Appeals Comments
Hearing Type
Issue
Initiating Party
Form
Date Completed
Decision
Hearing Date
Hearing Time
Hearing Decision Date
Hearing Decision Comments
Location
IW rep
Employer rep
Decision Maker
Witness 1
Witness 2
Witness 3
Panel 1
Panel 2
Panel 3
3rd party 1
3rd party 2
3rd party 3
Cost Avoided
Cost Recovered
Dept Code
Dept Desc
Group
Closed
|
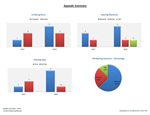
Report pulls by date range and dept/group. Displays all incidents with appeals.
- Main sheet: Bar chart of initiating party – by person (eg. employer, worker) and by year. Bar chart of hearing decisions by year. Bar chart of type of hearing by year. Pie chart of all decisions in percentage.
- Sheet two: Summary of all appeals in date range by year including name, claim number, class, injury, WSIAT, final decision date, hearing date, hearing type, issue, and decision. Includes a count of those that are completed. Report can be filtered by employer rep. This report will also highlight any hearing dates coming this week, next week or next month.
- Sheet three: Table report of all appeals in date range by name and includes WSIAT#, hearing date, hearing time, hearing type, issue, IW rep, decision date, decision and hearing decision comments. Report can be filtered by employer rep. This report will also highlight any hearing dates coming this week, next week or next month.
|
Incident Dashboard
|
DHZ
|
EE Key
Last Name First Name
EE ID
Gender
D O B
Age
Dept Code
Dept Desc
Group Description
Current Status
Current Union
Employment Date
Inc Date
Inc Time
Incident Position
Classification
Rate Group
Firm Number
Date Returned
Approved Denied
Account Number
Incident Type
Incident Type Desc
Cause Description 1
Cause Description 2
Cause Description 3
Cause Description 4
Cause Description 5
No of corrective actions
No of completed corr actions
Corr Act 1
Corr Act 2
Corr Act 3
Corr Act 4
Corr Act 5
Claim Number
Equipment
Location
Date Reported
Date Entered
Entered By
No days btwn Date of Inc and Rep
No days btwn Rep and Date Entered
No days btwn Inc Date and RTW Date
Returned to Modified Duties
Modified Start Date
Modified Stop Date
Days Lost
Total WCB Costs
Compensation Costs
Health Care Costs
Rehabilitation
Pension Costs
SIEF
Total Other Costs
Other Cost 1
Other Cost 2
Other Cost 3
Other Cost 4
Other Cost 5
Reo Orig Date
Claim Status
Claim Approval Date
Comp Start Date
Comp Stop Date
Inactive Flag
Closed Flag
Closed Date
Managing Staff
Modified Limit Period
Modified Limite Type
Month of Incident
Year End
Injury
Current Position
|
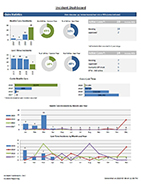
Report pulls up to 4 years of data by dept/group and provides option to exclude Employee name and Emp ID. Reports high level view of Incident Reporting activity.
- Main sheet: Click sample to view data on the dashboard. Notes: Days lost and costs are totals based on the date the incident occurred.
|
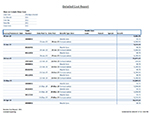
Detailed Cost Report
|
DH1
|
| EE Key |
| Last Name First Name |
| EE ID |
| Gender |
| D O B |
| Age |
| Dept Code |
| Dept Desc |
| Group Description |
| Invoice Number |
| Invoice Date |
| Claim Number |
| Benefit Type |
| Benefit Type Desc |
| Special |
| Award |
| Health Care Code |
| Date Paid To |
| Date Paid |
| Benefit Amount |
| Classification |
| Inc Type Desc |
| Firm No |
| Rate No |
| Class Unit |
| NAICS Code |
| Class Subclass |
| Location Code |
| Business Number |
| Inv Month |
Year End
SIEF-ADJ
Comp No
Injury
Incident Date
|
|
Report pulls information dept/group and by date range of invoice date. Include/exclude name and ID.
• Main sheet: Table of costs entered or imported into Parklane. Sorted by Invoice/Statement Date, claim number, Date Paid to (if applicable), Date Paid (if applicable), benefit type and amount. Other costs not included on this sheet.
• Second sheet: Table sorted by invoice/statement date, clam number and costs divided by type. Other costs not included on this sheet.
• Third sheet: Total costs by firm, year and benefit type. Other costs not included on this sheet.
• Fourth sheet: Costs by year and month, and cost type. Includes Other costs.
• Fifth sheet: Costs by claim number. Includes invoice/statement date, date paid to, date paid, type and amount.
• Sixth sheet: Costs by name (if included in report), invoice/statement date, claim number, incident class, incident type, benefit type and amount.
|
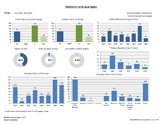
Statistics and Averages
|
DH3
|
Key Number
Department Group
Dept Description
Last Name First
Emp ID
Position
Job Status
Inc Date
Month of Incident
Inc Time
Claim Status
Managing Staff
Date Reported
No days btwn Date of Inc and Rep
Last day worked
First day off
Expected RTW date
Date Returned
No days btwn First Day off and RTW date
Month of First Day Off
Year of First Day Off
Month of Date Returned
Year of Date Returned
Classification
Claim Number
Incident Type Desc
Cause Description 1
No of corrective actions
No of completed corr actions
Entered By
Date Entered
No days btwn Rep and Date Entered
Returned to Modified Duties
Modified Start Date
Modified Stop Date
Total Days on Modified off
Days Lost
Total WCB Costs
Compensation Costs
Health Care Costs
Rehabilitation
Pension Costs
SIEF
Total Other Costs
Other Cost 1
Other Cost 2
Other Cost 3
Other Cost 4
Other Cost 5
Status Desc
Claim Approval Date
Inactive Flag
Closed Flag
Closed Date
No of Days btwn Inc Dt & Cls Dt
Days off up to Threshold
Percentage
Threshold Number
Business Calendar Days
Date Range Entered
Year End
Claims In Range
Year of Closed Date
NAICS Code |
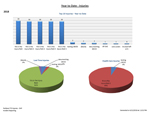
Report of statistics and averages. Report auto calculates days lost by business days or calendar days. Choice to calculate all claims (using today’s date for those not returned) or just those who have returned to work. Also included is the calculation of days to a threshold number – this is a number of the users’ choosing. This figure calculates days lost up until the number of your choice.
- Main sheet: Bar graphs include – Total claims started in date range, active cases in range, claim started in range by year, claims closed by year closed, average days lost by year, average days lost by type, average # of days to report incident by year, avg # days to report by class, avg #days on modified duties by class, average length of claims by class, average # days on mod duties by year. Pie charts include % of claims that are closed, % of incidents ever on modified duties, % of incidents currently on modified duties.
- Second sheet: Table of HC and LT claim stats only include – sorted by inc type: # of inc in range, # of corr actions, # of completed corr actions, # of outstanding corr actions, total WCB costs, average WCB costs/claim, average # days to report inc, average # days btwn inc date and entry date, # of claims on mod duties, # claims completed mod duties, average # days on mod duties.
- Third sheet: Table of lost time claim stats only include: Same as sheet two, but includes average days lost, average days lost up to threshold.
- Fourth sheet: Table of all incidents (excluding hazards and reos) that include: Sorted by year, table of total incidents started in range, total WCB costs, average # days to report, average # days to enter, average total days on modified, total # of corr actions, total completed corr actions, % of corr actions completed.
|
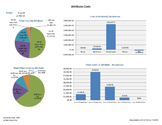
| Attributes and Costs |
DH5
|
Inc Date
Key Number
Last Name First Name
Department Group
Inc Type Desc
Classification
Cost
Other Cost
Status Desc
Department Desc
Year End
Rehab Cost
Health Care Cost
Compensation Cost
Pension Cost
SIEF Cost
Other1 Cost
Other2 Cost
Other3 Cost
Other4 Cost
Other5 Cost
Firm Number
Rate Number
Emp ID
Claim No
Attributes
NAICS Code |
Report of attributes and costs. Choose up to 30 attributes.
- Main sheet: Pie graphs with total costs by attribute and total other costs by attribute. Bar graphs include cost of all selected attributes by type of cost and a bar graph for other costs. Bar chart of number of incidents per attribute by year.
- Sheet two: Table of attributes by year. Includes total costs per attribute and total other costs.
- Sheet three: Table by attribute and incident type. Includes cost breakdown by cost type and totals.
- Sheet four: Same as above by other costs
- Sheet five: Table of incident classifications and attributes with cost breakdown and totals
- Sheet six: Same as above by other costs
- Sheet seven: Table by year and attributes with breakdown of costs and totals.
- Sheet eight: Same as above by other costs.
|
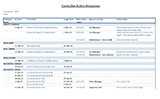
Corrective Action Responses
|
DH7
|
| Inc Date |
| Key Number |
| Department Group |
| Last Name First |
| Status Desc |
| Classification |
| Correction |
| Person Assigned |
| Position or Company |
| Telephone |
| Email |
| CC Email |
| Date Assigned |
| Target Date |
| Completion Date |
| Comments |
| Inc Type Desc |
| Department Desc |
| Worksite |
| Happened |
| Doing |
| Add Info |
| Attribute |
| What Happened DTL |
| What Doing DTL |
| Emp ID |
| Action Taken |
| Recommendation |
| Dt Email Sent |
| Dt Action Taken Recv |
| From WEB |
| Date Action Taken |
| Date Received |
| Name on Action |
|
Report of corrective actions and all responses
- Main Sheet: Table of employee, incident date, corrective action, target date, date action taken, name of person who submitted action, action taken.
|
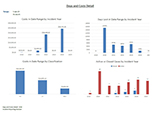
| Days and Costs Detail |
DH8
|
Inc Date
Key Number
Department Group
Last Name First Name
Status Desc
Classification
No active employees in dept group
Costs associated with that claim
Other Cost
Days associated with that claim
Inc Type Desc
Department Desc
Year End
Clain Number
Union (ATOI)
Rehab Cost
Health Care Cost
Compensation Cost
Pension Cost
Refund
Other1 Cost
Other2 Cost
Other3 Cost
Other4 Cost
Other5 Cost
Firm Number
Rate Number
Emp ID
NAICS Code
What happened Details
What doing details
Additional Information
Last Comp review date
Last Comp review activity
Next review date
Next review activity
Last general comment
User notes
First day off
Date reported
Expected RTW
Date returned
Managing Staff
Injury
Closed checkbox
Date closed
Inactive
Sub-classification
Position(ATOI)
Location
Mod duties start
Mod duties Stop
Employee Status(ATOI)
Causes 1
Causes 2
Causes 3
Causes 4
Causes 5
Corr Action 1
Corr Action 2
Corr Action 3
Corr Action 4
Corr Action 5
Total Cost
Total Other Cost
Total Rehab Cost
Total Health Care Cost
Total Compensation Cost
Total Pension Cost
Total Refund
Total Other1 Cost
Total Other2 Cost
Total Other3 Cost
Total Other4 Cost
Total Other5 Cost
From Date Range
To Date Range
Total Days Lost |
Reports on HC and LT claims and includes costs and days occurring in the date range, AND total costs and days of those claims. Also includes detailed incident information.
- Main sheet: 4 graphs of costs in range by inc year, costs in range by class, days lost in range by inc year, active vs closed cases by inc year.
- Sheet 2: Table of incidents including class, days and costs in range and total.
- Sheet 3: Health Care claims, including inc types, modified duties and costs
- Sheet 4: Lost time claims, including inc types, first day off, expected RTW, modified duties and costs
- Sheet 5: Worksheet includes all active claims (claims not closed), type, what happened and doing, last general comment, last completed review date and activity, next review date and activity
|