| Click Here for PDF Copy which includes a list of exported fields that are in each report. |
| Report name |
Report View (click image) |
Export Headings |
Report Description |
Days Absent
|
RHA

|
Last Firstname
Dept/Group
Time Start Date
Day of Week
Hours Type
Hours
Minutes
Hours Decimal
Continued
Status
Key
Dept Description
Age
Position
Employee ID
Comments
Daily Hours
Weekly Hours
Supervisor (PD)
|
Report pulls on Time Start Date and Dept/Group.
- Main sheet: Bar chart of total number of absences by day of week for dept/group for date range. Pie chart displays top ten absence types for dept/group and date range. Bar chart of total hours by day of week for dept/group and date range.
- Sheet 2: Table of counts by dept/group and employees displaying time taken by month and day of week.
- Sheet 3: Table of dept/group and employees displaying time taken by hours type (time code description) and day of week.
- Sheet 4: Table of dept/group, employee, hours type, #of times hours type was used and total hours for hours type.
- Sheet 5: Table of time code counts by age range and day of week.
- Sheet 6: Table of time code counts by position and day of week.
|
Case Status |
RHB

|
Last Firstname
Dept/Group
Current Level
Final Level
Level Start Date
Level Projected Duration
Level Projected Completion
Level Completion Date
Level Actual Duration
Level Effectiveness Result
Level Actions 1
Level Actions 2
Level Actions 3
Level Actions 4
Level Actions 5
Level Actions 6
Level Actions 7
Level Actions 8
Level Comments
Supervisor
Support Start Date
Time Entry Start Date
Reason
Monitor Assigned
Completion Date
Result
Comments
ER Key
Status
Dept Description
Emp ID
Next Review Date
Activity
Supervisor (PD) |
Pull report by case start date range, dept/group.
- Main sheet: Bar chart of number of open cases by year started. Chart of number of completed cases by result that had a start date within range
- Sheet 2: Detailed table of open cases including: dept/group, name, time entry start date, current level, level start date, projected duration, reason, monitor assigned and number of cases for dept/group.
- Sheet 3: Detailed table of closed cases including name, support start date, supervisor, reason, completion date, result and comments + counts.
- Sheet 4: Counts of employees currently in a program by level. Counts of completed cases by result and ending level.
- Sheet 5: Counts of programs started in date range and counts of programs completed in date range.
|
Extended Weekend Report
|
RHC

|
Last Firstname
Dept/Group
Time Start Date
Day of Week
Hours Type
Hours
Minutes
Hours Decimal
Week Day Num
Year End
Status
Key
Dept Description
Emp ID
Supervisor (PD)
|
Pull report by time start date range and dept/group. Reports only absences that began on a Monday or on a Friday and had no continued absences following.
- Main sheet: Bar chart for dept/group by year and # of times a Monday or Friday was taken off (with no continued days). Includes table which displays the same.
- Sheet 2: Table with Employee name, month, # of times a Monday or Friday were taken off and totals.
- Sheet 3: Table displays dept/group, employee name, number of times a Monday or Friday was taken off (with no continued days) and totals.
- Sheet 4: Table of dept/group, hours type, total hours taken on a Monday or Friday (with no continuation) of those hours and grand totals.
|
Employee History
|
RHD

|
Last Firstname
Dept/Group
Position
Time Start Date
Day of Week
Hours Type
Hours
Minutes
Hours Decimal
Continued
Emp Key
Year End
Status
Dept Description
Emp ID
|
Pull by employee and time start date range.
- Main sheet: Bar charts of total instances by year and total occurrences by year for that employee. Pie chart of type of time most taken. Bar chart of total hours by day of week of all in the date range.
- Sheet 2: Table of year, time start date, day of the week, hours type and total hours taken. Includes count of days.
- Sheet 3: Detailed table of counts of hours type by month and year.
Sheet 4: Table of months and days of week and the counts of chosen time code that occurred on those days. Can filter by year and hours type (time code).
|
Substitute Hours |
RHE

|
Last Firstname
Dept/Group
Time Start Date
Day of Week
Hours Type
Hours
Minutes
Hours Decimal
Emp Key
Substitute 1 Name
Sub Hours Type
Continued
Hours
Minutes
Hours Decimal
Substitute 1 Key
Status
Dept Description
Emp ID
Substitute ID |
Pull by employee OR time start date range.
- Main sheet: Line graph of hours taken vs hours covered by substitute - totals by month for date range. Pie chart of percentage of total hours taken by month. Pie chart of percentage of total substitute hours by month. Bar chart of percentage of total hours covered by a substitute per month.
- Sheet 2: Table of dept/group time taken, time covered and percentage of time covered by month.
- Sheet 3: Table displaying name, time start date, hours type, # of hours taken, day of the week, sub name 1, hours taken by employee, hours covered by sub 1.
- Sheet 3: Shows substitute employee detail by name, who they subbed for, department subbed in, time start date, total hours subbed.
|
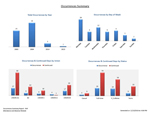
Occurrences Summary
|
|
Last First name
Dept/Group
Union
Time Start Date
Day of Week
Hours Type
Hours
Minutes
Hours Decimal
Continued
Status
Key
Department Desc
Year End
Age
Position
Emp ID
Active Case (Y/N)
Supervisor (PD)
Completion Date
Closed Date
Closed Flag
|
Pull by Dept/Group, time code, start date range. Option to exclude those already on a case.
Enter # of days criteria and/or # of occurrences criteria.
Will return those employees that fit either criteria.
- Main sheet: Bar graph of total occurrences by year, bar graph of total occurrences by day of the week, graph of occurrences and continued days by union and a graph of the same by status. Second page includes bar graph of occurrences and continued days by code, total hours of occurrences and continued days by code, total hours by union and total hours by status.
- Sheet 2: Employee detail - Table report of employee, time code, date, total number of occurrences, continued days and total days.
- Sheet 3: Employee totals: Table report of employee, time code, total number of occurrences, continued days and total days.
- Sheet 4: Dept/Group Detail - Collapsible table report of dept/group, employee, time code, date, total number of occurrences, continued days and total days.
- Sheet 5: Code Totals – Table report of dept/group, employee, time code description, total number of occurrences, continued days and total days.
- Sheet 6: Age Totals – Table report of dept/group, employee, time code, total number of occurrences, continued days and total days. Subtotals codes by employee. – Designed for those who chose multiple time codes.
|
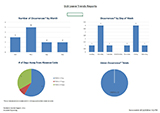
| Sick Leave Trends Report |
RHH
|
Last First name
Dept/Group
Dept Desc
Emp Status
Position
Union
Emp ID
Hours Type
Date
Day of Week
Supervisor (PD)
Key
Within One Day
Within Two Days
Within Three Days
Selection
Month
Count |
This report allows you to examine time codes (such as sick codes) that appear within 1-3 days of another time code. Eg. Identifying employees that take sick time right before/after vacation time.
Pull by date range, dept/group. 1st code selection for sick leave codes. 2nd code selection comparison code.
- Main Sheet: Bar graph of the number of occurrences identified by month, bar graph of occurrences by day of the week, pie chart of number of occurrences within 1, 2 or 3 days; pie chart of occurrences by union.
- Sheet 2: Table of employees with occurrences, includes position, supervisor and counts by month
- Sheet 3: Table of employees with occurrences, includes employment status, position, supervisor, counts of within 1, 2 and 3 days.
- Sheet 4: Table of employees’ time codes, date they occurred, day of the week, and codes flagged that fall within the 1-3 day away criteria.
|
| Consecutive Time |
RHJ |
Last Firstname
Dept/Group
Dept Desc
Emp Status
Position
Union
Emp ID
Hours
Hrs/Day
Start Date
Hours Type
Cont
WSuppPgm
PD Supervisor
Miscellaneous 1
Miscellaneous 2
Miscellaneous 3
Keys |
This report returns those who have been off consecutively by equal to or greater than: X number of days. Pull by date range, department/group and number of consecutive days.
- Main Sheet: Pivot table containing employee, whether they are on a case, hours type, and dates detail.
- Sheet 2: Pivot table of employee and days off.
- Sheet 3: Pivot table summarizing number of days by month.
- Sheet 4: Pivot table summarizing number of times employee met this criteria in the date range, active case vs no case and position.
|
| Multiple Time |
RHK |
Last Firstname
Dept/Group
Dept Desc
Emp Status
Position
Union
Emp ID
Hours
Hrs/Day
Start Date
Hours Type
Cont
WSuppPgm
PD Supervisor
Miscellaneous 1
Miscellaneous 2
Miscellaneous 3
Keys |
This report allows you to pull those employees who were off by the criteria of X number of days (random days) or more, but excludes those who are off a number of days consecutively.
• Main Sheet: Pivot table containing days detail including: name, whether they are on a case, hours type, date of absence and count.
• Sheet 2: Pivot table summarizing those who met the criteria by year and month.
• Sheet 3: Pivot Table summarizing number of days by employee.
|
| Accumulated Time |
RHL |
Last Firstname
Dept/Group
Dept Desc
Emp Status
Position
Union
Emp ID
Reason
Hours Accum.Prior to Level 1
Level
Level Start Date
Level Hours Accumulated
Daily Hours
Weekly Hours
Supervisor Name
Supervisor Name (PD)
Monitor
Managing Staff
Time entries that are being tracked
Projected Completion date
Completion date
Result
Actions 1
Actions 2
Actions 3
Miscellaneous 1
Miscellaneous 2
Miscellaneous 3
Key |
This report allows you to pull those employees on a case and displays how much time has been accumulated by level.
- Main Sheet: Pivot table summarizing employees by managing staff, level start date, level, accumulated hours, daily working hours and the number of total days – accumulated within each level.
- Sheet 2: Pivot table detailing each level, hours accumulated, daily working hours, projected completion, completion date, result of level and total number of days by level.
|