| Click Here for PDF Copy which includes a list of exported fields that are in each report. |
| Report name |
Report View (click image) |
Export Headings |
Report Description |
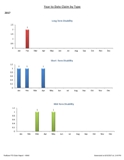
YTD Claims by Type |
AHA
|
First Day Off
Key Number
Type
Last Name
Department
Group
Status Desc
Emp Status
Managing staff
Union
Supervisor
|
Reports the details of claims types occurring in the CURRENT year.
- Main sheet: Chart of number of claims by each type and by month YTD. Table of number of claims by month and type YTD.
|
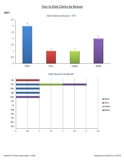
YTD Claims by Reason |
AHB
|
First Day Off
Emp Key
Reason Description
Last Name
Department
Group
Status Desc
Emp Status
Managing staff
Union
Supervisor
|
Reports the details of the reasons for claims occurring in the CURRENT year.
- Main sheet: Chart of number of claims by reason YTD. Chart of claim reasons by month YTD. Table of claims by reason and month.
|
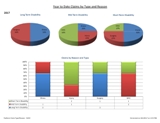
YTD Claims Types & Reason |
AHC
|
First Day Off
Emp Key
Last Name
Department
Group
Type
Reason Description
Status Desc
Emp Status
Managing staff
Union
Supervisor
|
Reports the details of the reasons and types of claims occurring in the CURRENT year.
- Main sheet: Pie charts of short and long term disability with percentage of each reason for claim YTD. Bar chart of claim reason and type with totals YTD.
|
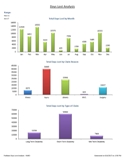
Days Lost Analysis |
AHD
|
First Day Off
Emp Key
Last Name
Reason description
Type
Department Group
Days Lost
Status Desc
Emp Status
Managing staff
Union
Supervisor
|
Analysisof the total days lost of claims occurring for the date range.
- Main sheet: Chart of total days lost by status. Chart of total days lost by claim reason. Chart of total days lost by type of claim. Chart of total days lost by union.
- Second sheet: Table of total days lost detail by Dept/Group and Reason.
- Third sheet: Table of total days lost detail by Dept/Group and Type.
|
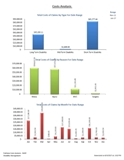
Costs Analysis |
AHE
|
First Day Off
Emp Key
Last Name
Department Group
Reason
Type
Cost
Status Desc
Insurance Company
Emp Status
Managing staff
Union
Cost 1
Cost 2
Cost 3
Cost 4
Cost 5
Supervisor
|
Analysis of the total costs of claims occurring for the date range.
- Main sheet: Pie chart of total costs of claims by type. Pie chart of total costs of claims for reason. Bar chart of total detailed costs for claims occurring in date range. Chart of total costs of claims by month.
- Second sheet: Table of detailed costs by claim type.
- Third sheet: Table of detailed costs and claim information by Group/Dept.
- Fourth sheet: Table of details costs summarized by Group/Dept and type.
|
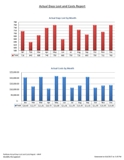
Actual Days Lost & Costs Report |
AHF
|
Month
Department Desc
Insurance Company
Cost applied
Lost days entered
Cost 1
Cost 2
Cost 3
Cost 4
Cost 5
|
Reports actual days lost and costs generated by claims each month (regardless of the start date of claim).
- Main sheet: Charts of costs applied each month and days lost applied each month.
- Second sheet: Table of detailed costs and days lost by month.
- Third sheet: Table of detailed costs and days lost by Dept/Group and month.
|
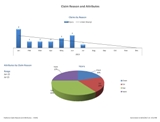
Claim Reason and Attributes |
AHG
|
First Day Off
Key Number
Department Group
Last Name
Reason
Attribute
Status Desc
Type
Emp Status
Managing staff
Year End
Union
Supervisor
|
Analysis of the claim reason and attributes (1 reason, up to 10 attributes)
- Main sheet: Chart of number of that claim reason by year. Pie chart of percentage of attributes selected applied to that claim reason. Chart with number of attributes by claim type.
- Second sheet: Table of number of claims by type occurring with selected attributes by Dept/Group.
|
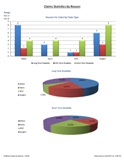
Claim Stats by Reason |
AHH
|
First Day Off
Key Number
Department Group
Last Name
Status Desc
Type
Reason
Emp Status
Managing staff |
Reason statistics for date range.
- Main sheet: Chart of reasons for claim by claim type. Pie charts of each claim type with percentage of reasons.
- Second sheet: Table of totals of claim reasons by Dept/Group.
|
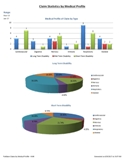
Claim Stats by Medical Profile |
AHI
|
First Day Off
Key Number
Department Group
Last Name
Status Desc
Type
Medical Profile
Emp Status
Managing staff
Union
Position
Supervisor
|
Medical profile statistics for date range.
- Main sheet: Chart of medical profile totals by type of claim. Pie charts of each claim type with percentage of medical profiles.
- Second sheet: Table of totals of medical profiles by Dept/Group.
|
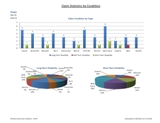
Claim Stats by Condition |
AHJ
|
First Day Off
Key Number
Department Group
Last Name
Status Desc
Type
Condition
Emp Status
Managing staff
Union
Position
Supervisor
|
Condition statistics for date range.
- Main sheet: Chart of number of claim conditions by type of claim. Pie charts of claim types and percentage of conditions.
- Second sheet: Table of totals of claim conditions by Dept/Group.
|
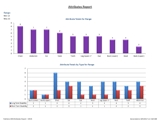
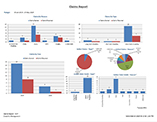
Attributes Report |
AHK
|
First Day Off
Key Number
Department Group
Last Name
Status Desc
Type
Reason
Attribute
Emp Status
Managing staff
Year End
Union
Employee ID
Email Address
Position
Supervisor Key
Supervisor Name
Date Returned
Case Closure Outcome
Case Closure Outcome Date Close
Close Date
Modified Duties Start Date Modified Duties Stop Date REO
REO 1st day off
REO RTW date
REO Comments
|
Contains a variety of graphs and totals of up to 30 attributes in a time period.
- Main sheet: Chart of totals of attributes. Chart of attribute totals by type. Chart of attribute totals by reason. Pie chart of percentage of attributes applied to claims within the range.
- Second sheet: Totals of attributes by Dept/Group.
- Third sheet: Table of attributes occurring by month. Table of attributes occurring by year (if date range permits).
|
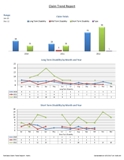
Claim Trend
|
AHL
|
First Day Off
Key Number
Department Group
Last Name
Status Desc
Type
Active employees in Dept or Group
Reason
Emp Status
Managing staff
Year End
Union
Was Occupational Claim
Supervisor (PD)
Emp ID
Position
|
3 year analysis of claims.
- Main sheet: Chart of claim totals by type and year. Line chart of LTD and STD totals by month over all years. Claim reason totals by year.
- Second sheet: Count of all claim types and status by year.
- Third sheet: NEW Count of all claims by dept/group by reason and year.
- Fourth sheet: NEW count of all claims by dept/group by year and type.
|
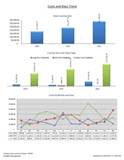
Costs and Days Trend
|
AHM
|
First Day Off
Key Number
Department Group
Last Name
Status Desc
Type
No active employees in Dept Group
Total COSTS associated with that claim
Total DAYS associated with that claim
Reason
Insurance
Year
Month
Emp Status
Managing staff
Year End
Was Occupational Claim
Reference
Cost 1
Cost 2
Cost 3
Cost 4
Cost 5
Supervisor (PD)
Emp ID
|
3 year* analysis of ACTUAL days and costs generated within that time frame (regardless of when the claim occurred).
- Main sheet: Costs - Total costs per year of claims. Costs by claim type and year. Costs by month and year. Days – Total days per year of claims. Days by claim type and year. Days lost totals by month and year.
- Second sheet: Table of days and detailed costs by year and month.
- Third sheet: Total days and detailed costs of claims by Dept/Group by year.
- Fourth Sheet: NEW – Total days and costs details by year and type of claim.
(*up to 3)
|
Who's Off Report
|
AHN

|
Key Number
Department Group
Last Name First
Position
Acc Date
First Day Off
Guideline RTW date
Expected RTW date
Med Review
User Comments
Type
Status Desc
Reason
Managing staff
Lost Time Days
Age of claim in days
Age of claim in months
Reference
Emp Status
Union
Review Date
Activity
REO
REO First Day Off
Dept Description
Supervisor (PD)
Emp ID
Effective Date
End of benefit period
Additional Dept 1
Additional Dept 2
Nature
Ben Submitted Date
Ben Commencement Date
|
Statistics of current disability claims as of the date of report. This report includes only those who have not returned to work.
- Main sheet: Chart of total claims currently by claim type, pie charts of claim reasons and status. Bar chart of total claims existing by reason and claim type.
- Second sheet: Table claim details including type, reason, claim number, name, dept/group, first day off, REO first day off (if applicable), age of claim in days, age in months, lost time days associated.
- Third sheet: Table of dept/group, name, position, type of claim, REO indicator, accident date, first day off, expected RTW date and totals by dept/group.
- Fourth sheet: Table claim details by Managing staff and includes emp name, accident date, REO?, type, reason, status, expected RTW, last review date and associated activity.
- Fifth sheet: Table detailed by managing staff and includes name, REO?, type, status, reason, age of claim in days, age of claim in months and count of claims by managing staff.
|
Claim Report
|
AHP
|
Key Number
Department Group
Dept Description
Last Name First
Position
Acc Date
First Day Off
Expected RTW date
Date Returned
Reference No
Med Review
User Comments
Type
Status Desc
Reason
Nature
Medical Profile
Conditions 1
Conditions 2
Conditions 3
Conditions 4
Conditions 5
Case Closure Outcome
Managing staff
Lost Time Days
Emp Status
Closed
Closed Date
Year End
Union
Was Occupational Claim
Returned to Mod Duties
Limitation Period
Mod Duties Start
Mod Duties Stop
Supervisor
Emp ID
Insurance Company
Additional Dept 1
Additional Dept 2
REO
Date Range Entered
More Info
Department Code
Inactive
Guideline RTW Date Guideline Code
Age of emp time of Claim
|
Statistics of all disability claims that occurred within date range.
- Main sheet: Bar graph of claims that have started and returned by reason. Bar graph of claims started and returned by type. Bar graph of claims started and returned by year. Pie charts of active claims by type and reason. Bar charts of number of active claims by type and reason. Bar charts of number of claims by medical profile, condition and insurance company.
- Second sheet: Table of all claim details by year, name, insurance company, type, first day off, date returned, REO indicator, reason, return to mod duties, closed indicator, closed date, lost time days and count of claims.
- Third sheet: Active claims (closed date blank) by type, name, first day off, status, REO indicator, reason, condition, return to mod duties indicator, lost time days and claim count.
- Fourth sheet: Currently off by type, name, first day off, status, REO indicator, reason, condition, return to mod duties indicator, lost time days and count of claims.
- Fifth sheet: Currently on modified duties, type, name, first day off, date returned, reason, condition, mod duties start date and count of claims.
- Sixth sheet: Table of claim started by type, year and department. REOs not included in count.
- Seventh sheet: Table of claims started by type and year. REOs are not included. Table of claims started by type, year and reason. REOs are not included.
|
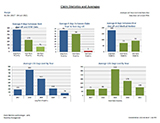
Statistics and Averages
|
AHQ
|
Key Number
Department Group
Dept Description
Last Name First
Position
Acc Date
First Day Off
Expected RTW date
Date Returned
Reference No
Med Review
User Comments
Type
Status Desc
Reason
Nature
Medical Profile
Conditions 1
Conditions 2
Conditions 3
Conditions 4
Conditions 5
Total days off
Num Days Delay Acc Ill and First Day
Num Days Delay Med Rev Date of Acc Ill
Emp Status
Closed
Closed Date
Year End
Date Range Entered
Month of First Day Off
Year of First Day Off
Month of Date Returned
Year of Date Returned
Emp ID
Claims In Range
Modified Duties Start
Modified Duties Stop
Num Days Modified Duties
Num of days btwn First day off and Close
Num Days btwn First day off and RTW
Indicator
Days off up to Threshold
Percentage
Num Days btw Acc Ill and DtEnter
Num Days btw Med Rev and Date entered
Num Days btw Exp RTW and Actual RTW
Case Closure Outcome
Case Closure Outcome Date
Status Date
Date Entered
Threshold Number
Business Calendar Days
Guideline RTW Date Guideline Code
Age of emp time of Claim Num of days from Guideline RTW Dt & RTW Dt
|
Report of statistics and averages. Report auto calculates days lost by business days or calendar days. Choice to calculate all claims (using today’s date for those not returned) or just those who have returned to work. Also included is the calculation of days to a threshold number – this is a number of the users’ choosing. Eg. # of days when STD becomes LTD, or # of days when benefits expire.
- Main sheet: Column chart of – Average # days between First day off and RTW date, Average # days between claim start & first day off, Average # days between first day off and medical review date, Average LTD & STD days lost by year, Average # days lost by Reason, Claims started and RTW, Claims started by type, % of claims approved vs. denied, claims currently off vs RTW, % of claims RTW, % of claims returned to modified duties, % of claims currently on modified duties, claims started by month and year, claim returned by month and year.
- Second sheet: Table sorted by Reasons including - # claims started, # of claims returned, # of claims closed, # of claims started on modified, average days lost, average days lost up to threshold, % of claims that reached threshold, average days between Accident date and First day off, average days between Accident date and Medical review date, average number of days on modified duties.
- Third sheet: As above by Medical profile
- Fourth sheet: As above by Department or Group
- Fifth sheet: As above by Year
|
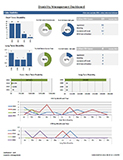
Disability Dashboard
|
AHR
|
Emp Key
Last First Name
Date of Birth
Dept Group
Emp ID
Status
Position
Union
Date Acc/Sick
Type
Reason
Medical Profile
Condition
RTW Date
Days Lost
Total Costs
Managing staff
Close Indicator
Closed Date
First Day off
DM year
Status Desc
REO
Reference
Insurance Company
Expected Return
No days between First day and RTW
Returned to Modified Duties
Modified Start Date
Modified Stop Date
Claim Approval Date
Inactive Flag
Month
Year End
Year Num
Nature
Supervisor Name
|
Report pulls up to 4 years of data by dept/group and provides option to exclude Employee name and ID. Reports high level view of Disability Management activity.
- Click sample to view data included in the dashboard. Days lost are auto-calculated by business days. Mid-term data included on separate tab.
Note: Source data also includes column containing manually recorded days lost, should you wish to customize the report to display this information instead.
|