| Click Here for PDF Copy which includes a list of exported fields that are in each report. |
| Report name |
Report View (click image) |
Export Headings |
Report Description |
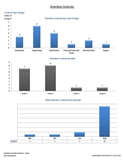
Overdue/Open Controls |
AHA
|
Risk Date
Asst Type
Inspector
JHSC
JHSC 2
Location
Sub Location 1
Sub Location 2
Hazard type 1n
Hazard type 2
Hazard description
Hazard due date
Risk level
Control
Recommendation
Control due date
Responsible
Email
Resolution
Year End
|
Report pulls assessments based on date range of: control due dates up until current day. Will display only open controls that fall within that date range.
- Main Sheet: Graphs of # of overdue controls by control type, # of overdue controls by risk, # of overdue controls by hazard type-1, pie chart of overdue controls divided into person responsible.
- Sheet 2: Table of overdue control counts by person responsible, date, hazard types 1&2, and any responses recieved.
- Sheet 3: Table of overdue control counts by assessment date including - location, hazards description and recommendation made and due dates.
|
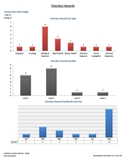
Overdue/Open Hazards |
AHB
|
Risk Date
Asst Type
Inspector
JHSC
JHSC 2
Location
Sub Location 1
Sub Location 2
Hazard type 1
Hazard type 2
Hazard description
Hazard due date
Risk level
Control Count
Year End
|
Report pulls assessments based on date range of: hazard due dates up until current day. Will display only open hazards that fall within that date range.
- Main Sheet: Graphs of # of overdue hazards by hazard type, # of overdue hazards by risk, # of overdue hazards by year and month, # of overdue hazards by hazard type-2.
- Sheet 2: Table of overdue hazard counts by Date of assessment including – location2, hazard type 1&2, hazards description, risk level and # of assigned controls.
- Sheet 3: Table of overdue hazard counts and assigned control counts sorted by original assessment date and hazard type.
|
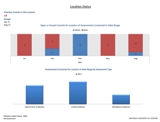
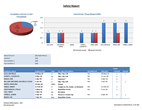
Location Status |
AHC
|
Risk Date
Asst Type
Inspector
JHSC
JHSC 2
Location
Sub Location 1
Sub Location 2
Hazard type 1
Hazard type 2
Hazard description
Hazard due date
Risk level
Control
Recommendation
Control due date
Control Status
Responsible
Email
Resolution |
Report pulls assessments based on date range of: original assessment dates. Includes all elements of assessment occurring in chosen location and within date range (i.e. open and closed).
- Main Sheet: Graphs of open vs closed controls for that location. Graph of number of assessments for that location by assessment type. Graph of hazard types identified in that location.
- Sheet 2: Summary of assessment type numbers by location.
- Sheet 3: Table of controls for that location – includes sub loc #2, hazards description, recommendation, control due date and counts of # of controls that are open or closed. Dates will appear red if overdue.
|
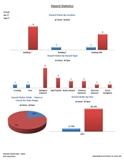
Hazard Statistics |
AHD
|
Risk Date
Asst Type
Location
Sub Location 1
Sub Location 2
Hazard type 1
Hazard type 2
Risk level
Hazard Due Date
Hazard status
Control Total
Controls Open
Controls Closed
Year End
|
Report displays up to 3 years of hazard statistics. Date range is based on assessment date.
- Main Sheet: Graph comparing hazard type 1 numbers by year. Graph comparing hazard type 2 numbers by year.
- Sheet 2: Hazard status numbers by Location. Hazard status numbers by hazard type 1. Pie chart displaying percentage of open vs closed hazards for date range. Graph displaying open vs closed hazard by year.
- Sheet 3: Table of hazard type 1 counts by year of occurrence and location.
- Sheet 4: Table of hazard type 2 counts by year of occurrence and location.
- Sheet 5: Table of locations and hazard type 1&2 with hazard status numbers – open vs closed
- Sheet 6: Table of location, sublocation1, hazard type 1&2, number of hazards with corresponding control status numbers – open vs closed
|
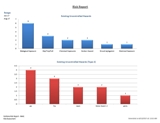
Risk Report |
AHE
|
Risk Date
Asst Type
Location
Sub Location 1
Sub Location 2
Hazard type 1
Hazard type 2
Risk level
Hazard status |
Date range is based on assessment date and includes risk and hazard statistics. Excludes No Hazard Found.
- Main sheet: Graph of uncontrolled hazards type1 for date range. Graph of uncontrolled hazards type 2 for date range. Graph of risk levels by location sorted by most risk.
- Sheet 2: Collapsible table of all three location tiers and corresponding risk level counts.
- Sheet 3: Collapsible table of all 3 location tiers, hazard type and status (open vs closed) numbers.
- Sheet 4: Collapsible table of all three location tiers, hazard type 2 and status (open vs closed) numbers.
|
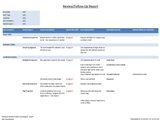
Review/Follow-Up Report |
AHF
|
Risk Date
Asst Type
Location
Sub Location 1
Sub Location 2
Hazard type 1
Hazard type 2
Hazard description
Hazard due date
Risk level
Control
Recommendation
Control Due date
Resolution
Responsible
Email
Review follow up comments
Date of comment
Asst no |
This graph report can be pulled by Assessment date, Hazard due date or control due date. Much like the review/follow up panel in the module, it displays open records only.
- Main Sheet: Graph displaying overdue and coming due hazards and controls. Graph with number of responses received by risk level. Graph of assessments conducted vs responses received to date.
- Sheet 2: Table of subloc2 with hazards descriptions, due dates, recommendations and any resolutions received.
- Sheet 3: Table of subloc2 with hazard descriptions, control due dates, recommendations and any resolutions received.
- Sheet 4: Summary of outstanding hazards and controls including due dates, person responsible and recommendation.
|
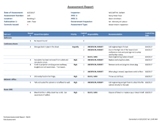
Assessment Report |
AHG
|
Risk Assessment Number
Date of Assessment
Assessment Type
Location
Sub Location 1
Inspector
JHSC 1
JHSC 2
Gov Inspector
Hazard Number
Sub Location 2
Hazard Description
Risk Level
Priority
Status of Hazard
Control Number
Responsibility
Recommendation
Control Desc
Control Due Date
Resolution
Date Resolved |
This report will provide assessment details in table form. Can be pulled by assessment #, date and location, date and inspector, or date and JHSC.
- Main Sheet: Assessment report – best for single assessment pulled – displays date, assessment number, locations, #of controls, inspector, JHSC (if applicable), Gov Inspector (if applicable), assessment type. Table sorted by sublocation 2, person responsible, hazard description, priority, recommendation, due date.
- Sheet 2: Assessment report – best for multiple assessments pulled – Report filter contains dates, assessment numbers, assessment types and location. Includes #of controls issued and range of assessment dates. Table report includes sublocation 1 and 2, person responsible, hazard description, priority, recommendation, due date.
- Sheet 3: Status report –– Report filter contains dates, assessment numbers, assessment types, locations and responsibility. Includes #of controls issued, # of resolutions received a percentage completed. Table report includes sublocation 2, hazard description, priority, hazard status, recommendation, due date, resolution and date resolved.
|
Safety Report
|
AHH
|
| Incident Date |
| Dept/Group |
| Dept Description |
| YEAR Incident |
| Last Name, First Name |
| Classification |
| Injury |
| Inc Type Description |
| Cause |
| Correction |
| Corr Date Assigned |
| Corr Target Date |
| Completion Date |
| Person |
| Position |
| Action Taken |
| Comments |
| Date Completed |
| Has Risk Asst |
| Asst No |
| Risk Date |
| Asst Type |
| Location |
| Sub Location 1 |
| Sub Location 2 |
| Hazard No |
| Hazard Type 1 |
| Hazard Type 2 |
| Hazard Description |
| Hazard Due Date |
| Risk Level |
| Control Number |
| Control |
| Recommendation |
| Control Due date |
| Resolution |
| Resolution Date |
| Closed |
| Responsible |
| Email |
| Review Follow Up Comments |
| Date of Comment |
|
This report will display incidents occurring in a date range and indicate whether they have a risk assessment linked to them.
- Main Sheet: Pie chart of completed controls vs not completed, bar chart of #of controls issued vs closed controls by those responsible. Summary table of all incidents in date range and whether they have linked risk assessments.
- Sheet 2: Detailed report on all incidents with linked assessments – including name, date, inc type, assessment number, hazard type 2, person responsible, control number, recommendation, resolution, resolution date, closed/not closed.
- Sheet 3: Detailed report on all incidents with no linked risk assessments – including name, date, inc type, classification, and from TCC panel in incident reporting: Correction, date assigned, target date, completion date, person, action taken
|
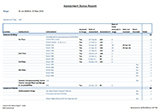
| Assessment Status Report |
AHM
|
Assessment Type
Location
Sublocation1
Sublocation2
Date of Assessment
Date Last Assessed
Never Assessed
Assessed in Range
Num of times assessed in range
Assessment #
Inspector
Additional Inspectors
JHSC
JHSC Name 1
JHSC Name 2
Date Range Chosen |
This report will display which locations have been assessed or have not been assessed within a date range.
- Main sheet: Bar chart those areas not assessed in the range and those never assessed. Bar chart of areas that were assessed in the range.
- Sheet 2: Table of areas assessed in the date range by location, sublocation 1 and 2, date of assessment, assessment number and totals.
- Sheet 3: Table of areas not assessed in the date range by location, sublocation 1 and 2, date last assessed, whether they were never assessed and totals.
- Sheet 4: Table of all locations, whether they were assessed in range, date of assessment, assessment number, number of times assessed in range, date last assessed, whether they were never assessed and totals by location.
|