Click Here for PDF Copy which includes a list of exported fields that are in each report.
|
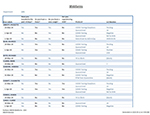
| Report name |
Report View (click image) |
Export Headings |
Report Description |
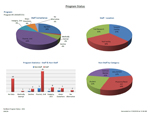
Program Status |
AHA
|
Date given
Emp.Key
Department
Gender
Status
Lot Number
Age
Program
Protocol
Non-Staff
Facility
Category
Name
Dept Description
Emp ID
Supervisor Name
Dept Code
|
Report displays graphs and tables of one program – staff and NON-staff. Includes those employees with no results.
- Main Sheet: Pie chart of overall staff compliance, pie of staff results by location and pie of non-staff by non-staff category. Also includes a bar graph of staff and non-staff results by protocol.
- Sheet 2: Table sorted by department and employee name. Includes date given and applicable protocol. Totals by dept/group and grand totals.
- Sheet 3: Dept/Group Compliance. Table sorted by dept/group of staff only results. Includes each protocol and the percentage of each.
- Sheet 4: Table of protocol numbers for staff and non-staff.
- Sheet 5: Table of lot numbers, name of recipient, date given and sex. Totals by lot number, sex and grand totals.
|
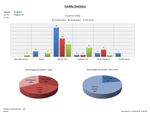
Facility Statistics |
AHB
|
Date given
Facility
Department
Gender
Status
Lot Number
Age
Program
Protocol
Non-Staff
Category
Name
Dept Description
Emp ID
Supervisor Name
Dept Code
|
Report displays graphs and tables of a program by facility – staff and NON-staff. Includes only results recorded for that program in the Facilities chosen – does not includes those with NO data.
- Main Sheet: Bar graph of protocol results by facility. Pie chart of results received by facility for staff and pie for results received by facility for non-staff.
- Sheet 2: Table of protocol numbers by month and facility – staff and NON-staff.
- Sheet 3: Table of protocol numbers by month and facility – staff only
- Sheet 4: Table of protocol numbers by month and facility – NON-staff only.
- Sheet 5: Provides table sorted by facility and includes name, lot number and protocol. Includes totals by facility and grand totals.
|
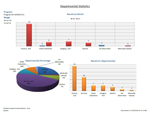
Departmental Statistics |
AHC
|
Date given
Emp.Key
Department
Gender
Status
Lot Number
Age
Program
Protocol
Non-Staff
Facility
Category
Name
Dept Description
Emp ID
Supervisor Name
Dept Code
|
Report displays graphs and tables of department(s)data (or Group).
- Main Sheet: Graph of protocol by month. Pie chart of overall protocol percentage of all dept/groups chosen. Bar chart of protocol results for all dept/groups chosen.
- Sheet 2: Table of Dept/Group, protocol numbers, and names. Includes totals of each protocol by dept/group and grand totals.
- Sheet 3: Compliance: Table of Dept/Group, percentage of each protocol. Includes overall percentage by dept/group and grand totals.
- Sheet 4: Table sorted by dept/group of each protocol numbers by month. Includes totals by dept/group and grant totals.
|
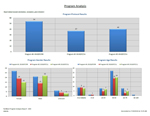
Program Analysis |
AHD
|
Date given
Emp.Key
Department
Gender
Status
Given by
Age
Program
Program Start Date M O H
Protocol
Non-Staff
Facility
Category
Name
Dept Description
Emp ID
Supervisor Name
Dept Code
|
Report displays comparison of 3 different SIMON programs. Counts default to exclude given elsewhere, denied, and exemptions – although they can be included by clearing the filter on the pivot tables.
- Main Sheet: Bar graph of the number of total results received by program. Bar graph comparing gender of total results received by program. Bar graph of total results received by program and age.
- Sheet 2: Table of dept/group, employee names and protocol results for all 3 programs.
- Sheet 3: Table of dept/group and protocol results for all 3 programs.
- Sheet 4: Table of 3 programs, facility and results by sex. Also contains Table of 3 programs, facility and result totals.
- Sheet 5: Table of Given By and protocol totals by 3 programs.
|
| Webforms |
AHE
|
Emp Key
Last Name First Name
Address
City
Prov State
Postal Zip
Country
Telephone
Birth Date
Gender
Emp ID
Status
Program
Protocol
Given by
Facility
Date Consent
Time Consent
Date Given
Time Given
Lot Number
Immunization site
Miscellaneous 1
Category
Operator
Date Entered
Non Staff
MOH Number
Account Submitted
Supervisors Name
Department
Question 01
Question 02
Question 03
Question 04
Question 05
Question 06
Question 07
Question 08
Question 09
Question 10
Question 11
Question 12
Question 13
Question 14
Question 15
Question 16
Question 17
Question 18
Question 19
Question 20
Question 21
Question 22
Question 23
Question 24
Question 25
Question 26
Question 27
Question 28
Question 29
Question 30 |
Report includes option to pull all records or most recent record only in a program.
- Main Sheet: Table of responses. Note: as the questions are different from form to form, this particular table needs to be set up each time or set up and saved on the system. Alternatively, all responses are available in the source data.
- Sheet 2: Table which includes employee name, phone number, department, supervisor (from PD), date given, protocol and lot number.
- Sheet 3: Table of statistics by protocol. Note: For current statistics, pull report by most recent record. For cumulative test results, pull all records.
|